If you want to understand how interconnected our planet is—how patterns and events in one place can affect life half a world away—study El Niño.
Episodic shifts in winds and water currents across the equatorial Pacific can cause floods in the South American desert while stalling and drying up the monsoon in Indonesia and India. Atmospheric circulation patterns that promote hurricanes and typhoons in the Pacific can also knock them down over the Atlantic. Fish populations in one part of the ocean might crash, while others thrive and spread well beyond their usual territory.
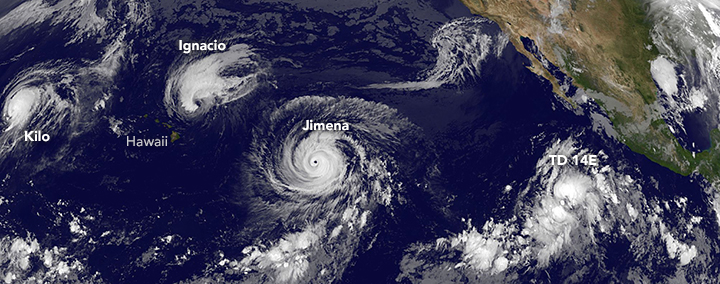
The GOES-West satellite observed four tropical cyclones roiling the Pacific on September 1, 2015, during an El Niño event. (Image courtesy of the NASA/NOAA GOES Project.)
During an El Niño event, the surface waters in the central and eastern Pacific Ocean become significantly warmer than usual. That change is intimately tied to the atmosphere and to the winds blowing over the vast Pacific. Easterly trade winds (which blow from the Americas toward Asia) falter and can even turn around into westerlies. This allows great masses of warm water to slosh from the western Pacific toward the Americas. It also reduces the upwelling of cooler, nutrient-rich waters from the deep—shutting down or reversing ocean currents along the equator and along the west coast of South and Central America.
The circulation of the air above the tropical Pacific Ocean responds to this tremendous redistribution of ocean heat. The typically strong high-pressure systems of the eastern Pacific weaken, thus changing the balance of atmospheric pressure across the eastern, central, and western Pacific. While easterly winds tend to be dry and steady, Pacific westerlies tend to come in bursts of warmer, moister air.
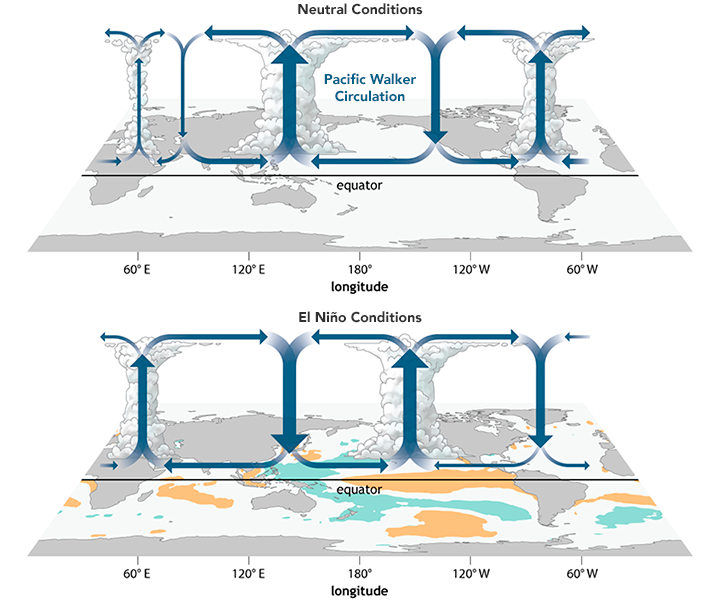
Atmospheric circulation over the equator—the Walker circulation—changes substantially with the arrival of El Niño. (Illustration by NOAA/Climate.gov)
Because of the vastness of the Pacific basin—covering one-third of the planet—these wind and humidity changes get transmitted around the world, disrupting circulation patterns such as jet streams (strong upper-level winds). We know these large-scale shifts in Pacific winds and waters initiate El Niño. What we don't know is what triggers the shift. This remains a scientific mystery.
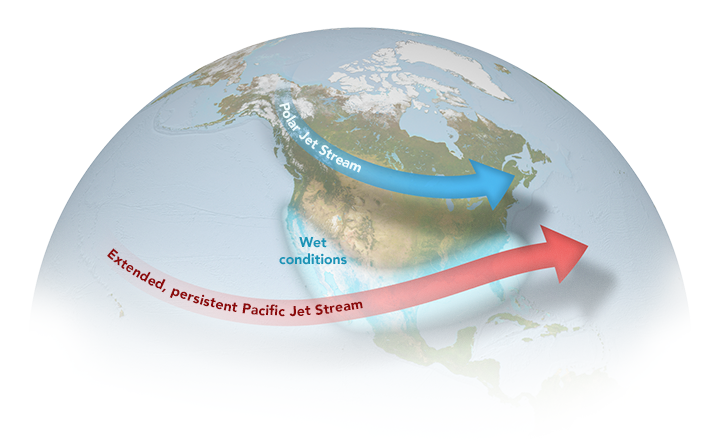
El Niño usually alters the Pacific jet stream, stretching it eastward, making it more persistent, and bringing wetter conditions to the western U.S. and Mexico. (NASA Earth Observatory illustration by Joshua Stevens.)
What is not a mystery is that El Niño is one of the most important weather-producing phenomena on Earth, a "master weather-maker," as author Madeleine Nash once called it. The changing ocean conditions disrupt weather patterns and marine fisheries along the west coasts of the Americas. Dry regions of Peru, Chile, Mexico, and the southwestern United States are often deluged with rain and snow, and barren deserts have been known to explode in flowers. Meanwhile, wetter regions of the Brazilian Amazon and the northeastern United States often plunge into months-long droughts.
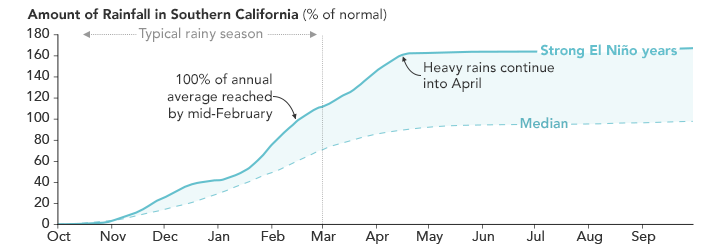
Typically dry regions can experience nearly two times as much rain during a strong El Niño. (NASA Earth Observatory chart by Joshua Stevens, using data from the California-Nevada Climate Applications Program.)
El Niño events occur roughly every two to seven years, as the warm cycle alternates irregularly with its sibling La Niña—a cooling pattern in the eastern Pacific—and with neutral conditions. El Niño typically peaks between November and January, though the buildup can be spotted months in advance and its effects can take months to propagate around the world.
Though El Niño is not caused by climate change, it often produces some of the hottest years on record because of the vast amount of heat that rises from Pacific waters into the overlying atmosphere. Major El Niño events—such as 1972-73, 1982-83, 1997-98, and 2015-16—have provoked some of the great floods, droughts, forest fires, and coral bleaching events of the past half-century.
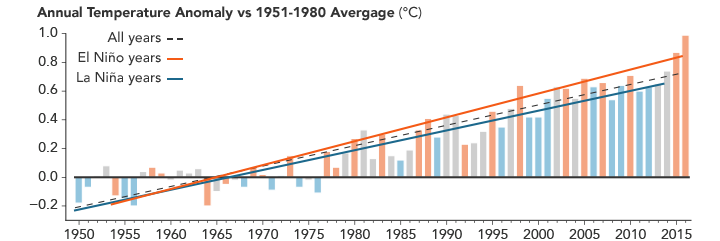
El Niño years tend to be warmer than other years. (NASA Earth Observatory chart by Joshua Stevens, using data from the Goddard Institute for Space Studies.)
NASA, the National Oceanic and Atmospheric Administration (NOAA), and other scientific institutions track and study El Niño in many ways. From underwater floats that measure conditions in the depths of the Pacific to satellites that observe sea surface heights and the winds high above it, scientists now have many tools to dissect this l'enfant terrible of weather. The data visualizations on the next page show most of the key ways that we observe El Niño before, during, and after its visits.
The ocean is not uniform. Temperatures, salinity, and other characteristics vary in three dimensions, from north to south, east to west, and from the surface to the depths. With its own forms of underwater weather, the seas have fronts and circulation patterns that move heat and nutrients around ocean basins. Changes near the surface often start with changes in the depths.
The tropical Pacific receives more sunlight than any other region on Earth, and much of this energy is stored in the ocean as heat. Under neutral, normal conditions, the waters off southeast Asia and Australia are warmer and sea level stands higher than in the eastern Pacific; this warm water is pushed west and held there by easterly trade winds.
Temperature anomalies in the ocean depths reveal the fingerprints of El Niño and the La Niña that follows. (NASA Earth Observatory visualization by Joshua Stevens, using data from the Global Data and Assimilation Office.)
But as an El Niño pattern develops and trade winds weaken, gravity causes the warm water to move east. This mass, referred to as the "western Pacific warm pool," extends down to about 200 meters in depth, a phenomenon that can be observed by moored or floating instruments in the ocean: satellite-tracked drifting buoys, moorings, gliders, and Argo floats that cycle from the ocean surface to great depths. These in situ instruments (more than 3,000 of them) record temperatures and other traits in the top 300 meters of the global ocean.
The visualization above shows a cross-section of the Pacific Ocean from January 2015 through December 2016. It shows temperature anomalies; that is, how much the temperatures at the surface and in the depths ranged above or below the long-term averages. Note the warm water in the depths starting to move from west to east after March 2015 and peaking near the end of 2015. (The western Pacific grows cooler than normal.) By March 2016, cooler water begins moving east, sparking a mild La Niña in the eastern Pacific late in 2016, while the western Pacific begins to warm again.
For hundreds of years, the temperature near the water surface has been measured by instruments on ships, moorings and, more recently, drifters. Since the late 1970s, satellites have provided a global view of ocean surface temperatures, filling in the gaps between those singular points where floating measurements can be made.
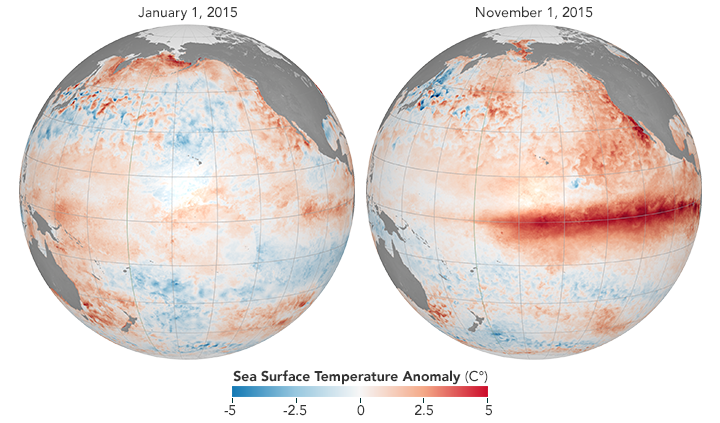
El Niño is associated with above-average equatorial sea surface temperatures. El Niño's signature warmth is apparent in the November 2015 map. (NASA Earth Observatory maps by Joshua Stevens, using data from Coral Reef Watch.)
Sea surface temperatures are measured from space by radiometers, which detect the electromagnetic energy (mostly light and heat) emitted by objects and surfaces on Earth. In the case of the oceans, satellite radiometers—such as the Advanced Very High Resolution Radiometer (AVHRR) on NOAA weather satellites and the Moderate Resolution Imaging Spectroradiometer (MODIS) on NASA's Terra and Aqua satellites—detect the strength of infrared and microwave emissions from the top few millimeters of the water.
The maps above show sea surface temperature anomalies in the Pacific from winter and fall of 2015. The maps do not depict absolute temperatures; instead, they show how much above (red) or below (blue) the surface water temperatures were compared to a long-term (30-year) average. The maps were built with data from a multi-satellite analysis assembled by researchers from NOAA, NASA, and the University of South Florida.
When deciding whether the Pacific is in an El Niño state, the climatologists at NOAA examine sea surface temperatures in the east-central tropical Pacific—referred to as the Niño 3.4 region (between 120° to 170° West). An El Niño is declared when the average temperature stays more than 0.5 degrees Celsius above the long-term average for five consecutive months. In 1997-98 and 2015-16, sea surface temperatures rose more than 2.5 degrees Celsius (4.5 degrees Fahrenheit) above the average.
Sea level is naturally higher in the western Pacific; in fact, it is normally about 40 to 50 centimeters (15-20 inches) higher near Indonesia than off of Ecuador. Some of this difference is due to tropical trade winds, which predominantly blow from east to west across the Pacific Ocean, piling up water near Asia and Oceania. Some of it is also due to the heat stored in the water, so measuring the height of the sea surface is a good proxy for measuring the heat content of the water.
Water expands as it warms, causing the surface of the ocean to rise. (NASA Earth Observatory map by Joshua Stevens, using Jason-2 data provided by Akiko Kayashi and Bill Patzert, NASA/JPL Ocean Surface Topography Team.)
The animation above compares sea surface heights in the Pacific Ocean as measured by the altimeter on the OSTM/Jason-2 satellite and analyzed by scientists at NASA’s Jet Propulsion Laboratory. It shows sea surface height anomalies, or how much the water stood above or below its normal sea level. Shades of red indicate where the ocean was higher because warmer water expands to fill more volume (thermal expansion). Shades of blue show where sea level and temperatures were lower than average (water contraction). Normal sea-level conditions appear in white.
As you watch sea surface heights change through 2015, note the pulses of warmer water moving east across the ocean. When the trade winds ease and bursts of wind come out of the west, warm water from the western Pacific pulses east in vast, deep waves (Kelvin waves) that even out sea level a bit. As the warm water piles up in the east, it deepens the warm surface layer, lowering the thermocline and suppressing the natural upwelling that usually keeps waters cooler along the Pacific coasts of the Americas. (Look back at the underwater temperature animation to see this phenomenon.)
As temperatures change due to El Niño, other effects ripple through the ocean. In the eastern Pacific, the surge of warm water deepens the thermocline, the thin layer that separates surface waters from deep-ocean waters. This thicker layer of warm water at the surface curtails the usual upwelling of cooler, nutrient-rich water—the water that usually supports rich fisheries in the region. This loss of the nutrient supply is evident in declining concentrations of sea surface chlorophyll, the green pigment present in most phytoplankton. Changes in water properties such as oxygen and carbon content also affect marine life.
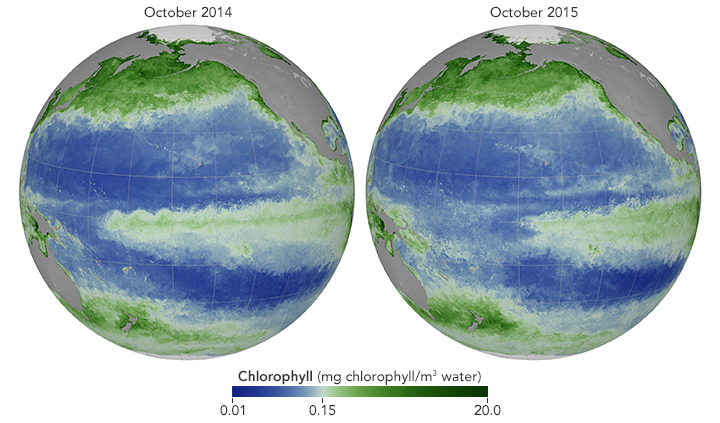
Chlorophyll concentrations rise and fall with the presence of phytoplankton. During the 2015 El Niño, warming water temperatures changed where phytoplankton bloomed in the Pacific Ocean. (NASA Earth Observatory maps by Joshua Stevens and Stephanie Schollaert Uz, using data from MODIS, NASA OceanColor Web, and SeaDAS.)
The images above compare sea surface chlorophyll in the Pacific Ocean as observed in October 2014 and 2015. Shades of green indicate more chlorophyll and blooming phytoplankton. Shades of blue indicate less chlorophyll and less phytoplankton. (For a larger view of these maps, click here.)
Historic observations have shown that with less phytoplankton available, the fish that feed upon plankton—and the bigger fish that feed on the little ones—have a greatly reduced food supply. In most extreme El Niños, the decline in fish stocks has led to famine and dramatic population declines for marine animals such as Galapagos penguins, marine iguanas, sea lions, and seals.
The behavior of the winds and waters are tightly intertwined in the Pacific basin during an El Niño event. "It is like the proverbial chicken-and-egg problem," says Michael McPhaden of NOAA’s Pacific Marine Environmental Laboratory. “During an El Niño year, weakening winds along the equator lead to warming water surface temperatures that lead to further weakening of the winds.”
The image below shows the dominant direction of the winds and changes in their intensity near the ocean surface as observed by NASA’s RapidScat instrument. Arrows show how the primary wind direction changed from January 2015 to January 2016. The change in wind speed is represented by colors, with surface wind speeds increasing in teal-green areas and decreasing in purple areas.
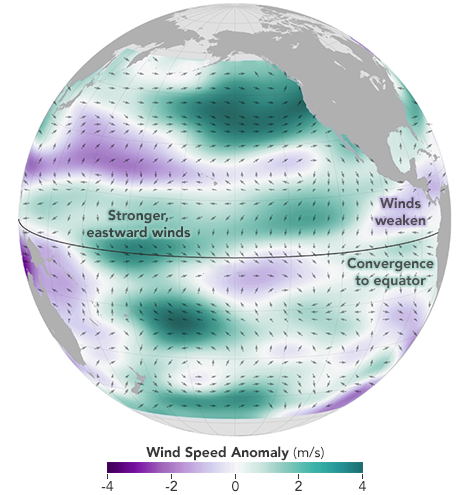
During an El Niño, wind patterns shift all over the Pacific Ocean. Most significantly, they get weaker (purple) in the eastern tropical Pacific, allowing warm surface water to move toward the Americas (NASA Earth Observatory map by Joshua Stevens using RapidScat data from the Jet Propulsion Laboratory.)
The El Niño signal is evident in the eastward-blowing winds in the tropical western and central Pacific. Winds near the equator (5° North to 5° South) blew more forcefully from west to east in the western and central Pacific; meanwhile, the easterly (east to west) trade winds weakened near the Americas. These wind shifts allowed pulses of warm water to slosh from Asia toward the Americas over the course of 2015. The signal also shows up in a convergence in the eastern Pacific; that is, the winds in the tropics (23°N to 23°S) were generally moving toward the equator. This reflects intense convection, where warm surface waters promote intense evaporation and rising air. (See the Walker circulation illustration on page 1.) Consequently, new air masses move toward the equator to replace the rising air.
Other changes occurred well away from the equator; scientists refer to these as teleconnections. For instance, RapidScat detected a strong clockwise-rotating (anti-cyclonic) wind anomaly in the northeastern Pacific that may have been the result of stronger-than-normal atmospheric circulation (Hadley cell). That is, air that rose above the super-heated waters of the central tropical Pacific sank back to the surface at higher latitudes with more than usual intensity.
By changing the distribution of heat and wind across the Pacific, El Niño alters rainfall patterns for months to seasons. As the warm ocean surface warms the atmosphere above it, moisture-rich air rises and develops into rain clouds. So while the majority of precipitation tends to occur over the west Pacific warm pool in neutral years, much more develops over the central and eastern Pacific during an El Niño event.
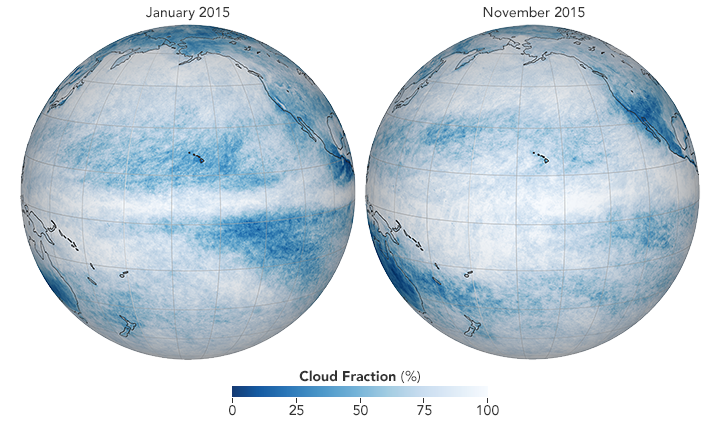
Just as El Niño influences ocean surface temperatures, it also alters the amount and location of clouds over the Pacific. (NASA Earth Observatory maps by Joshua Stevens, using data from the NASA Earth Observations.)
The globes show cloud fraction over the Pacific Ocean in January and November 2015 as measured by the MODIS instrument on NASA's Aqua satellite. The data show how often and how much the sky was filled with clouds over a particular region. Cloudiness is a result of moisture rising from the ocean surface into the atmosphere. During an El Niño (November image), cloud cover increases in the eastern Pacific due to the warm water releasing more moisture and heat into the atmosphere. Those clouds can lead to more rain, but they also shade the water by day and trap heat near the surface at night.
El Niño was identified and named long before science caught up with the phenomenon. For centuries, Peruvian fishermen reaped a bounty off the Pacific coast of South America, where north- and west-flowing currents pulled cool, nutrient-rich water from the deep. But every so often, the currents would stop or turn around; warm water from the tropics would drive the fish away and leave the nets empty. These periodic warm spells were most noticeable around December or January—around the time of Christmas, the birth of "the boy child."
Some of the first scientific descriptions of El Niño came during exchanges between the Lima Geographical Society and the International Geographic Congress in the 1890s. But the roots of El Niño stretch far back into history, long before the birth of Jesus of Nazareth or the arrival of Peruvian fisherman. The chemical signatures of warmer seas and increased rainfall have been detected in coral samples and in other paleoclimate indicators since the last Ice Age. This pattern of water and wind changes has been going on for tens of thousands of years.
Earth scientists, historians, and archaeologists have theorized that El Niño had a role in the demise or disruption of several ancient civilizations, including the Moche, the Inca, and other cultures in the Americas. But the recorded history of El Niño really starts in the 1500s, when European cultures reached the New World and met indigenous American cultures.
Historical research has suggested that the Spanish conquest of the Incas and Peru may have been aided by El Niño conditions. When Francisco Pizarro first sailed from Panama along the west coast of South America in 1524, his progress was slowed and ultimately stopped by persistent south and southeasterly winds—which follow the pattern of the north-flowing coastal currents. In 1525-26, however, Pizarro got much farther down the coast, riding on favorable northeasterly winds, according to geographer Cesar Caviedes, author of El Niño in History.
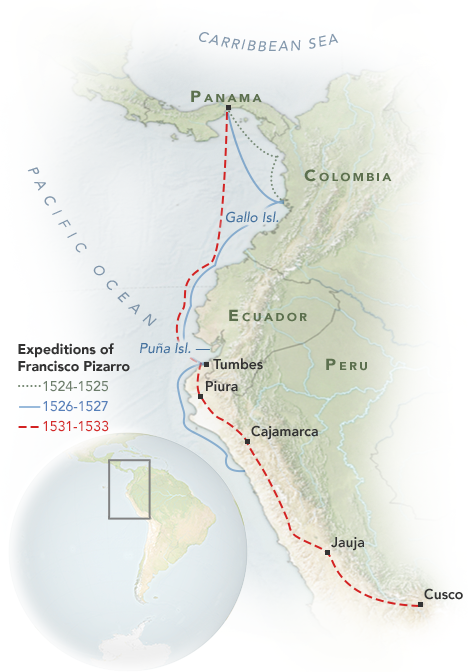
The expeditions of Francisco Pizarro provide hints that his conquest may have been aided by the winds of El Niño. The advance of Pizarro and his conquistadors was most successful during the El Niño of 1532. (NASA Earth Observatory map by Joshua Stevens.)
When Pizarro returned in 1531-32, his ships made haste down the coast, pushed along again by strong northeasterlies—the kind that blow in El Niño years. Once Spanish troops moved inland, they found blooming deserts, swollen rivers, and rainfall in the usually arid regions of Peru and Ecuador. The humid air and moist land allowed the conquistadors to sustain their long march and to avoid Incan settlements on the way to establishing a foothold in the country.
Between 1789 and 1792, the monsoon in South Asia failed multiple times, according to historical and scientific records. There is evidence that several other climate patterns—some of them affected by or coinciding with Asian monsoon patterns and El Niño—influenced storm tracks and westerly winds near Europe. According to some researchers, the combination of climate anomalies and unusual weather led to crop failures in Europe and set the stage for some of the unrest that exploded in the French Revolution of 1789.
In the book Late Victorian Holocausts, historian Mike Davis suggests that at least three great famines in the late 19th century were connected to El Niño. Extreme weather and the collapse of monsoon circulation—patterns documented by British and Indian officials, among others—led to great droughts and a few floods in 1876-78, 1896-97, and 1899-1900. Between 30 to 60 million people perished in India, China, and Brazil, among other countries; hundreds of millions suffered through hunger and social and political strife. Though European colonialism and the spread of laissez faire capitalism played important roles in these calamities, the global reach (teleconnections) of El Niño and La Niña likely spurred the great droughts, crop failures, and malaria outbreaks.
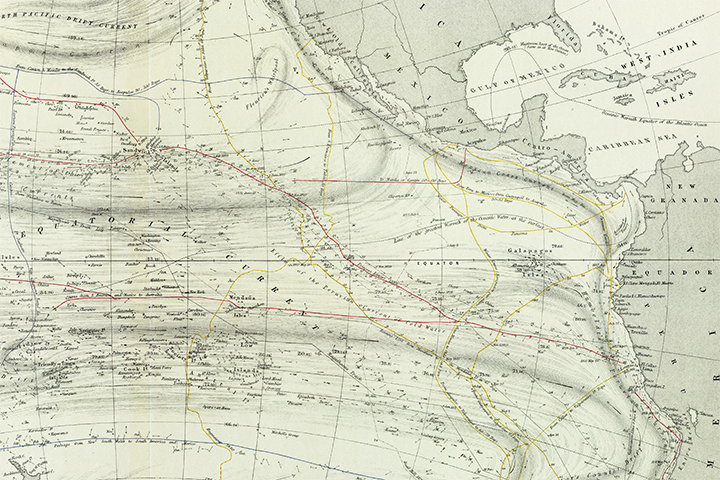
This 1856 map by Alexander Keith Johnson depicts temperatures, currents, and ship routes in the eastern Pacific, as they were known at the time. (Cropped image used under a Creative Commons license, courtesy of the David Rumsey Map Collection.)
In the 1920s, a transplanted statistician and physicist from Britain began to piece together the big picture of this global weather-maker. While working as Director of Observatories in India and studying the monsoon, Gilbert Walker noted that "when pressure is high in the Pacific Ocean it tends to be low in the Indian Ocean from Africa to Australia; these conditions are associated with low temperatures in both these areas, and rainfall varies in the opposite direction to pressure." He dubbed the alternating atmospheric weather pattern the "Southern Oscillation," noting how highs over the tropical Pacific coincided with lows over the Indian Ocean, and vice versa.
It would be another four decades before Jacob Bjerknes—a Norwegian-born scientist who helped found the meteorology department at the University of California, Los Angeles—made the final connection between the alternating warm and cool patterns in Pacific waters and the atmospheric circulation described by Walker. The entire pattern came to be known as ENSO, or El Niño-Southern Oscillation, and it includes the sister phenomenon known as La Niña.
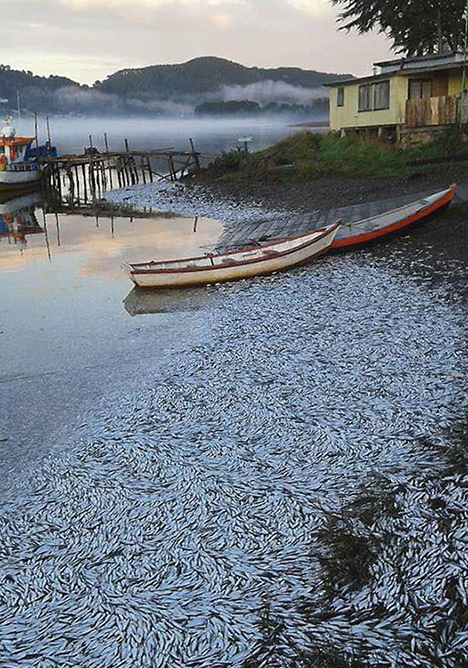
In April 2016, nearly 8,000 tons of sardines died and washed up along the coast of Chile, likely the result of El Niño related changes in the ocean. (Photographs courtesy of Armada de Chile.)
At least 26 El Niños were recorded in the 20th century, and each brought its own wrinkles that piqued the interest of scientists and sent ripples through economies. The El Niño of 1957-58, for instance, caused serious damage to the kelp forests off California. Another event in 1965-66 crashed the market for guano (fertilizer) in Peru and also spurred the use of soybeans for animal feed (instead of fish meal). In 1972-73, the anchovy population crashed, leading to the death of millions of sea birds and to destabilizing effects on the Peruvian economy and government.
In 1982-83, the first major El Niño to get significant real-time study, sea birds on Christmas Island abandoned their young and flew out over the Pacific in a desperate search for food. Nearly 25 percent of the fur seal and sea lion populations off Peru starved to death.
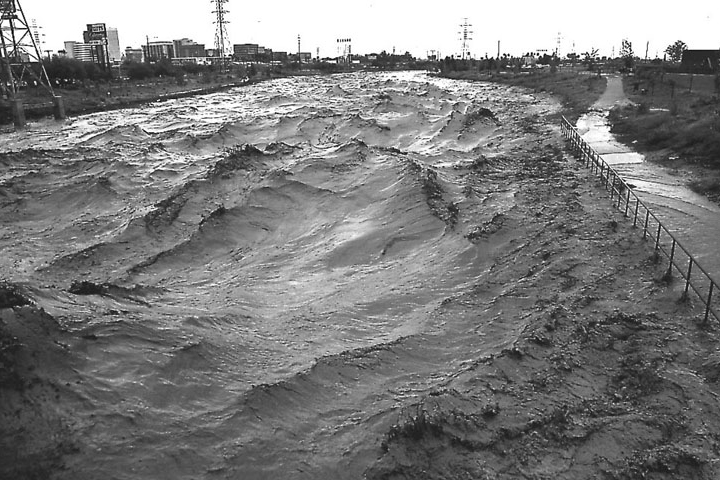
Swollen with the rains of the 1983 El Niño, the Santa Cruz River roils near Tucson, Arizona. (Photograph courtesy of Peter L. Kresan, University of Arizona/U.S. Geological Survey.)
"To ask why El Niño occurs is like asking why a bell rings or a pendulum swings," atmospheric scientist George Philander wrote in a 1999 paper. "It is a natural mode of oscillation. A bell, of course, needs to be struck in order to ring." After nearly 100 years of investigation, scientists are still not sure what rings the bell; they just know that it rings.
Fires raging in Indonesia. Fisheries collapsing off Peru. Delayed monsoon rains over India. Floods and mosquito-borne disease outbreaks in South America. Epic drought and mass migrations in southern Africa. Once an El Niño is declared, it seems every extreme weather-related event in the world is blamed on this phenomenon.
El Niño is the largest natural disruption to the Earth system, with direct impacts across most of the Pacific Ocean. Indirect impacts reverberate around the globe in patterns that scientists refer to as "teleconnections." Scientists are actively trying to understand how these changes in weather patterns in one area can alter the movement of air masses and winds in areas adjacent to and even far away from the source. According to the International Research Institute for Climate and Society at Columbia University, El Niño-Southern Oscillation is responsible for as much as 50 percent of year-to-year climate variability in some regions of the world.
So which impacts are actually typical and traceable to El Niño?
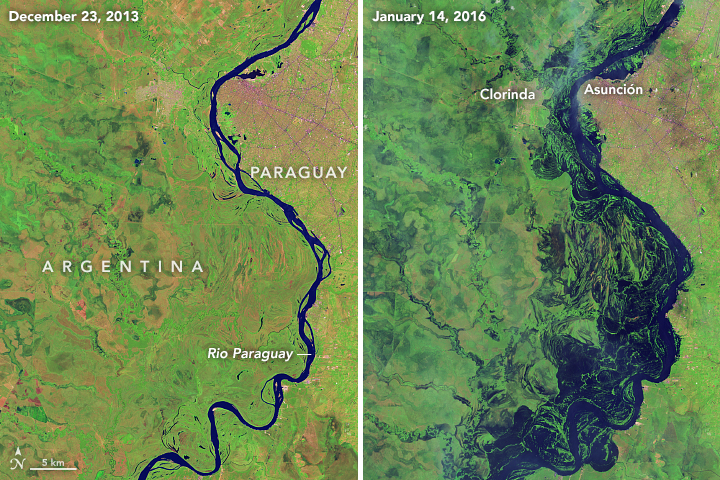
In late 2015 and early 2016, unusually heavy rainfall swamped South America. Months before the flooding, meteorologists warned of wetter-than-usual conditions on account of El Niño. The left image shows the same area under normal conditions. (NASA Earth Observatory images by Joshua Stevens, using Landsat data from the U.S. Geological Survey.)
The effects are most immediate in the equatorial Pacific. The thicker, warmer surface layer of water in the Eastern Pacific suppresses the upwelling of cooler, nutrient-rich water from the depths. Less nutrients mean less phytoplankton, which in turn leads to hunger all around the food web. Higher forms of marine life across the tropical Pacific—such as tuna, sea turtles, and seabirds—move to different feeding grounds when nutrient-poor surface waters shift eastward from the Western Pacific.
Subtle changes in the color of the ocean—which indicate shifts in the abundance and location of the phytoplankton (visible via the pigment chlorophyll-a)—were first observed from space by the Coastal Zone Color Scanner in the 1970s and 80s. In fact, imagery collected by CZCS during the very strong 1982-83 El Niño showed the regional demise of marine life around the Galapagos Islands. Fifteen years later, SeaWiFS compiled the first high quality, Pacific-wide view of chlorophyll-a during the very strong 1997-98 El Niño.
In one ironic twist, rainfall increases over the Eastern Pacific during an El Niño, which benefits life on the land. Even though life in the ocean is starving or moving to new feeding grounds, the plants and animals of the Galapagos and along the west coasts of North and South America usually get bountiful rain.
Changes in chlorophyll-a concentrations are visible in this animation, which compares phytoplankton in January and July 1998. Since then, scientists have improved both the collection and presentation of chlorophyll data. (Visualization courtesy of NASA/Goddard Space Flight Center, The SeaWiFS Project and ORBIMAGE, and the Scientific Visualization Studio.)
Although El Niño has the most direct impacts on life in the equatorial Pacific, its effects propagate north and south along the coast of the Americas, affecting marine life all around the Pacific.
According to Dan Rudnick of the Scripps Institution of Oceanography, changes in oceanic and atmospheric circulation off the coast of California—primarily changes in winds—decrease the normal upwelling of cooler, deep water. Additionally, atypical ocean currents can bring tropical species to California waters, such as manta rays, red tuna crabs, and yellow-bellied sea snakes.
Warm water in the Eastern and Central Pacific—and the moisture and energy it gives up to the atmosphere—fuels nascent tropical storms, enabling them to develop into hurricanes. Tropical storm development is also aided by typical El Niño wind patterns, which tend to have the same horizontal wind speeds and directions both near the surface and at higher altitudes. This lack of differences in wind velocity with height (that is, a lack of "wind shear") enables storms to continue pumping heat upward and to grow stronger. By contrast, there is greater wind shear over the Atlantic Ocean and Caribbean Sea during an El Niño, which inhibits hurricane formation by dissipating the upward motion of heat.
In the equatorial Pacific, as the warm pool propagates eastward, clouds and rainfall move with it and leave the Western Pacific in dry conditions that often lead to drought across Indonesia, southeast Asia, and northern Australia. The problems of drought are compounded by slash-and-burn land clearing. For example, in Indonesia it is common for farmers to clear-cut forests for lumber and to burn rainforest to develop the land. Normally, these fires are extinguished by the consistent rains that fall in the tropics. But when the rain dries up during a strong El Niño, those fires burn uncontrolled. Massive El Niño-fueled fires were blamed for thousands of premature deaths from air pollution in 1997-98 and contributed to as many as 100,000 deaths in 2015-16, according to a recent study by Harvard University scientists.
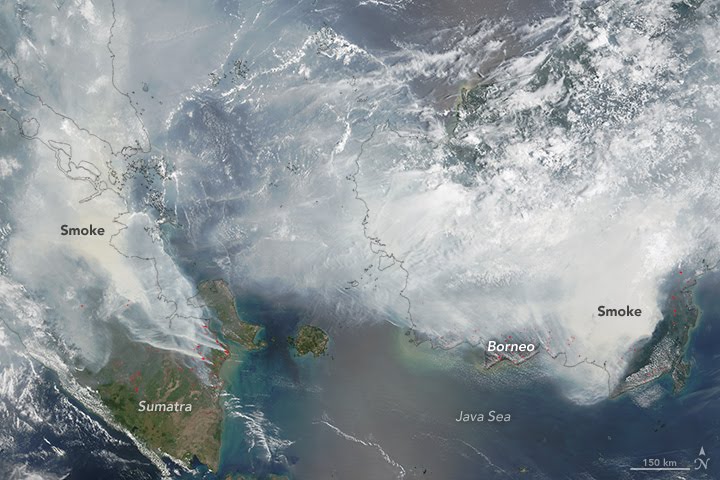
Heavy smoke blanketed Sumatra and Borneo in September and October 2015, as observed by NASA’s Terra satellite. Farmers often lose control of agricultural fires during El Niño-caused droughts in Indonesia. (NASA image by Jeff Schmaltz, LANCE/EOSDIS Rapid Response.)
Wildfires also release extra carbon dioxide into the air. Vegetation that is stressed from heat and drought cannot absorb as much atmospheric carbon as it normally takes up during photosynthesis. Because of this, atmospheric CO2 (as measured at the Mauna Loa observatory in Hawaii) has less of a seasonal decline during the Northern Hemisphere growing season. Thus, the rise in atmospheric CO2 is more pronounced during El Niño years.
While the impacts of an El Niño are predominately felt in the tropical Pacific, the massive reorganization of ocean heat, clouds, rainfall, and winds can affect weather patterns in other parts of the world. The atmospheric jet stream becomes faster and shifts its position, displacing the usual location of high- and low-pressure systems and altering normal storm tracks. This, in turn, modifies wet and dry areas, causing some places to experience droughts while others may get floods, landslides, and a redistribution of groundwater.
Central America typically becomes warmer and drier during El Niño years. In 1998 and 2015, reduced rainfall led to low water in the Panama Canal, causing operators to restrict some large ships from making the passage.
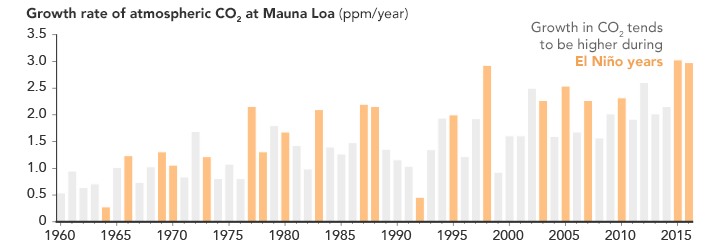
Atmospheric carbon dioxide has increased steadily since 1960. Data shows that the long-term rise in atmospheric CO2 (due to human activities) is more pronounced during El Niño years. (NASA Earth Observatory image by Joshua Stevens, using data from NOAA's Earth System Research Laboratory.)
In South America, Brazil typically experiences unusual heat. Less rain falls in the north, while more falls from southern Brazil to Argentina. Flooding in January 2016 displaced more than 150,000 people in Uruguay, Paraguay, and Argentina, and caused Paraguay’s Ministry of Public Health and Social Welfare to declare an alert for mosquito-borne diseases such as Dengue, Chikungunya, and Zika.
Although the impacts of every El Niño vary, more rain typically falls during the winter across the southern United States from California to Florida. For example, in 2015-16, the Pacific Northwest, the U.S. Midwest, and the Southeast states endured heavy rain. There were landslides in Northern California and flash floods in Louisiana and Alabama. Extreme rain fell in Southern California and led to mudslides.
The United Nations (U.N.) Office for the Coordination of Humanitarian Affairs reported in April 2016 that 60 million people across Africa, Asia, the Pacific, and Latin America needed food assistance due to weather extremes from the 2015-16 El Niño. Looking back at 1997-98, the U.N. attributed more than 20,000 deaths and $36 billion in infrastructure damage to that El Niño.
Although El Niño events are complex and evolve differently—as do their impacts and teleconnections—improved predictions would help communities to prepare for likely impacts and to minimize disruptions. With more advanced warning, resource managers and civic leaders could make adjustments to how they manage fisheries, which crops to plant, what resources to allocate to combating mosquitoes, and when to raise awareness of risks such as fire or mudslides.
