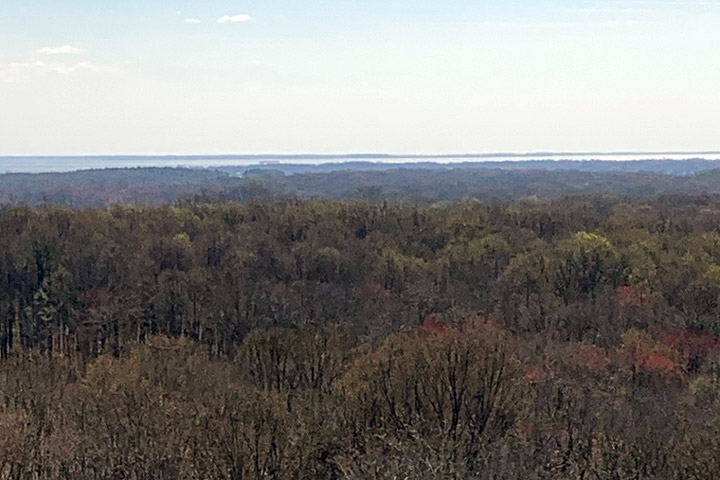
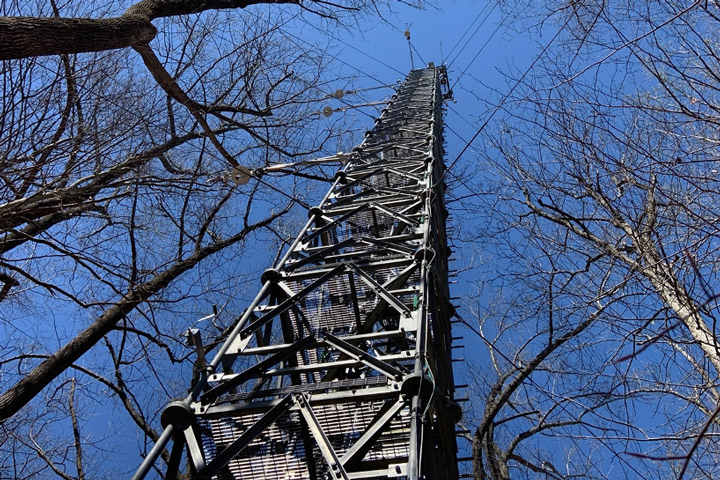
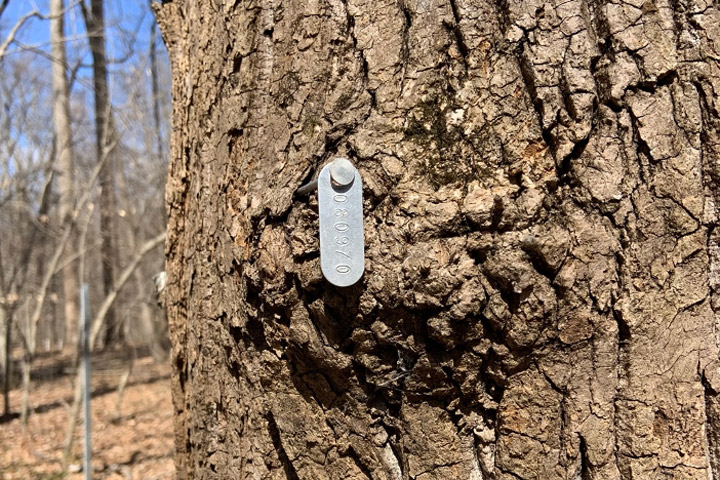
On a blustery March morning, Petya Campbell stood atop a 204-foot-tall tower and looked across the waving canopy of the leafless deciduous forest at the Smithsonian Environmental Research Center in Edgewater, Maryland. This forest is predominately tulip poplar (Liriodendron tulipifera), and the tower extends over trees that are over 120 feet tall.
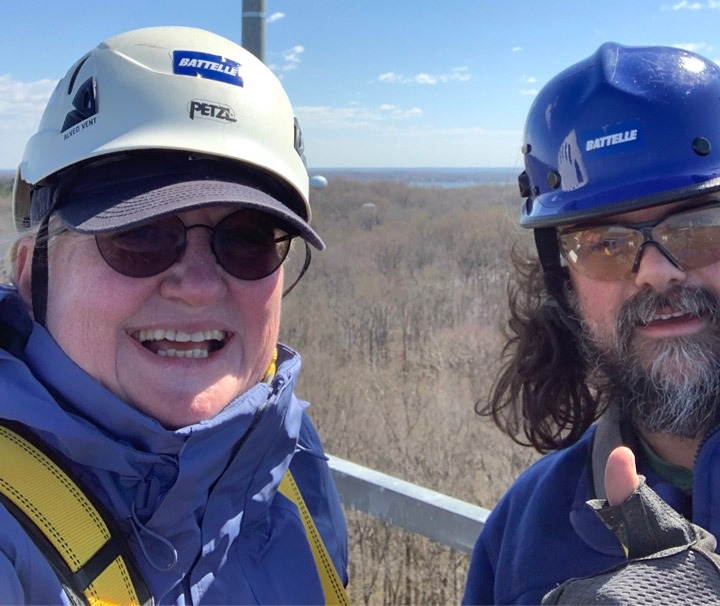
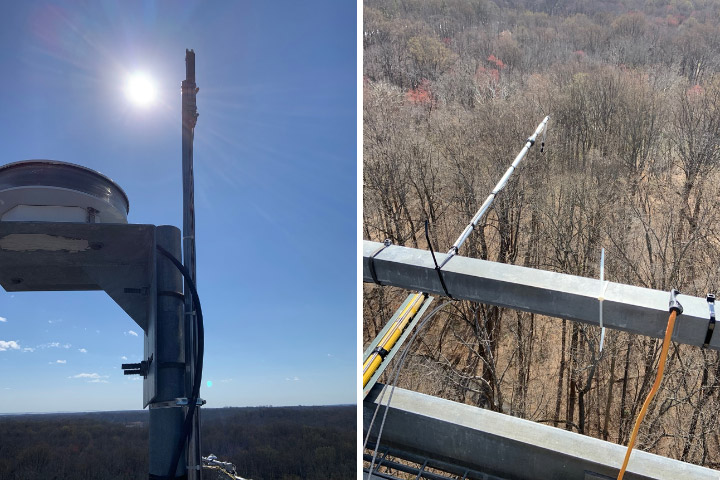
Petya, from the University of Maryland Baltimore County and NASA Goddard Space Flight Center, is working with Greg Cain, a master technician from the Battelle-managed National Ecology Observatory Network (NEON)—the U.S. National Science Foundation-funded program that runs the tower at the Smithsonian site (SERC). Petya and Greg were on the tower that day to install a new type of instrument, an automated spectrometer called a NoX (Near Infrared Box). The NoX measures the light reflectance off the forest canopy in hundreds of narrow spectral bands through the visible wavelengths we can see and into the near-infrared bands beyond our vision. The instrument will make these measurements every few minutes throughout the entire growing season.
In addition, NEON runs instruments on this tower that take measurements of the movement of carbon dioxide (CO2) into and out of the forest. CO2 is absorbed from the atmosphere into the trees through photosynthesis, so measuring the amount of CO2 taken up by the plants is a measure of forest productivity. These CO2 flux measurements are collected continuously and reported every half hour.
The time series of spectral reflectance measured by the NoX can provide information about leaf characteristics. For instance, it can tell scientists about the amount of green biomass and chlorophyll in the leaves, which determines the potential productivity of the forest; the amount of other leaf pigments that are used to protect the leaves from damage, which indicate when the trees are under stress; and the amount of water in the leaves, which can be used to detect drought stress.
Researchers will use data from the NoX to gain insight into the functioning of this deciduous forest as it responds to environmental conditions such as hot or cold spells, droughts or rainy periods, and sunny or cloudy days. They will observe seasonal changes from the time the leaves emerge in the spring, through the green of the summer, the changing colors of the autumn, and finally the loss of the leaves at the end of the growing season. Others can watch the forest change through the seasons using the phenocam, a web camera mounted on the tower that regularly takes photographs to monitor the changes in the forest.
Installing the NoX on the SERC tower is just the most recent deployment by Petya Campbell and Fred Huemmrich. Over the past couple of yeavrs, they have installed similar instruments on flux towers in the arctic tundra and boreal forest.
The NoX data will be compared with the tower flux data to develop and test relationships between spectral reflectance and forest productivity and the detection of stress responses under adverse conditions. Understanding these types of relationships and how they may differ between vegetation types and season will aid the development of future NASA missions such as the Surface Biology and Geology (SBG) study, and the Geosynchronous Littoral Imaging and Monitoring Radiometer (GLIMR), which will collect spectral information similar to the NoX over large areas of the Earth.
A Powerful Landscape
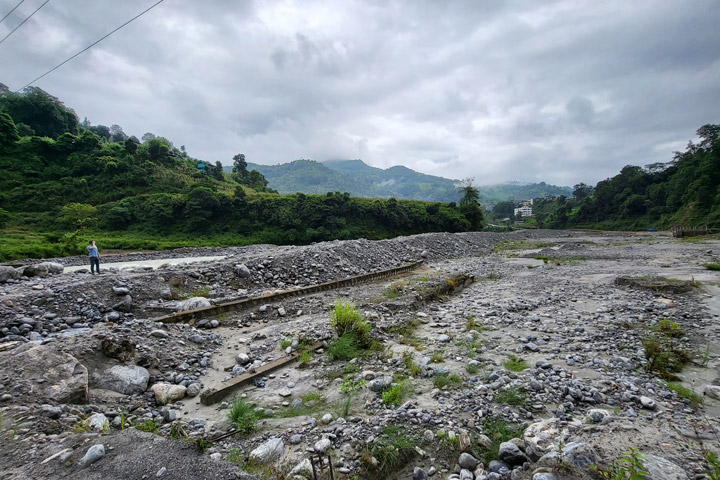
Umbrella in one hand, I gripped the metal cable of the suspension bridge as I looked down into the boiling Bhotekosi River coursing below me through a steep, verdant canyon. Due to the steep slopes, fragile geology, and frequent rainfall, Nepal is especially subject to natural disasters including landslides and flooding.
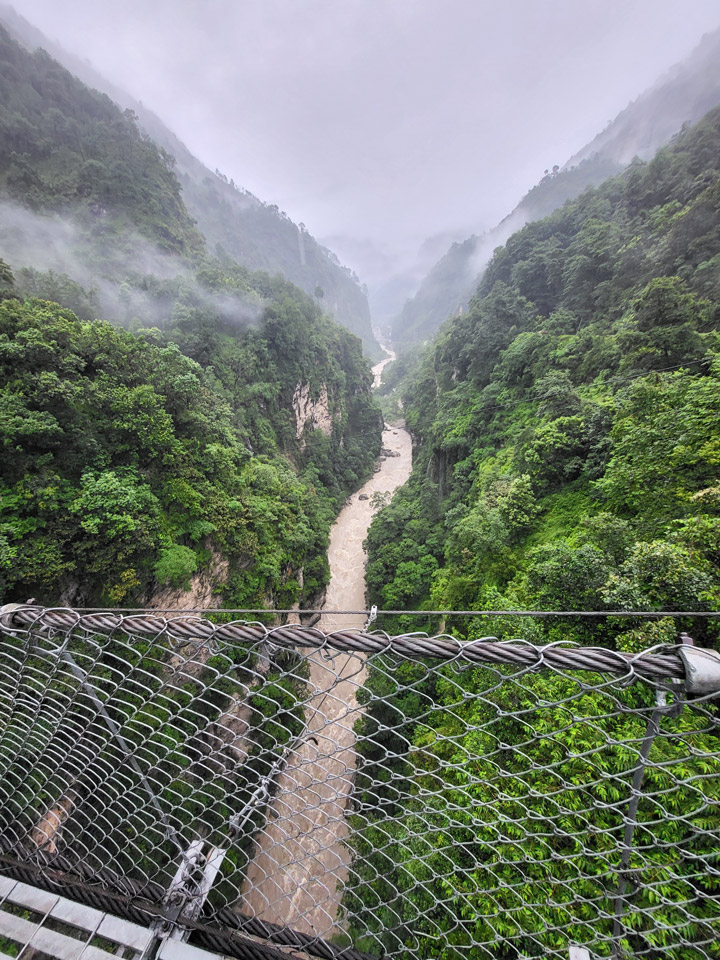
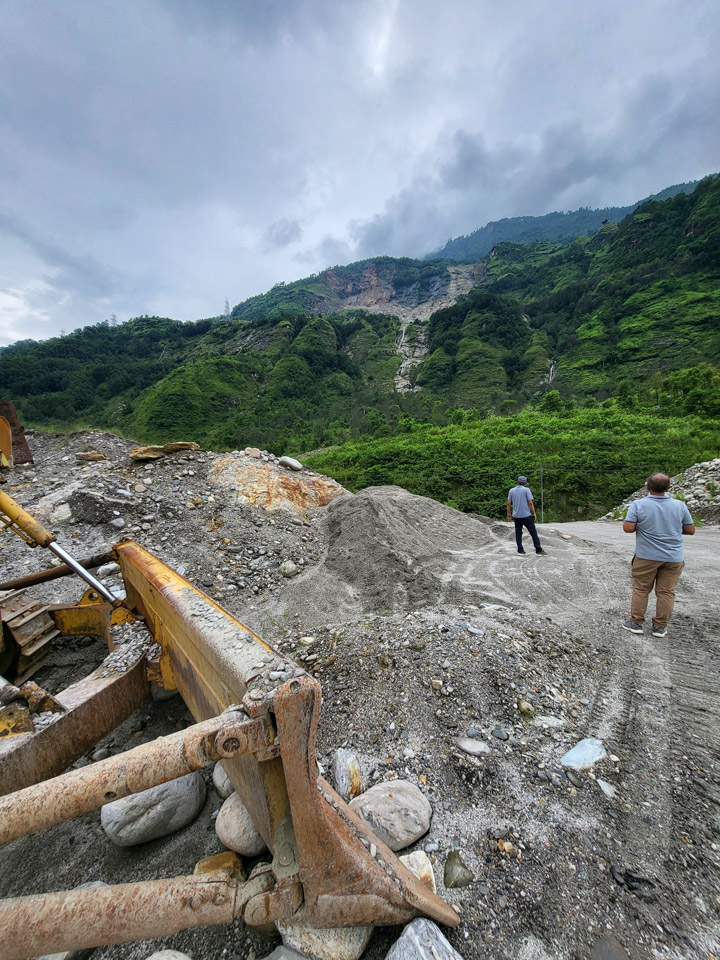
I found myself in this powerful landscape because I work for SERVIR, a joint NASA and USAID program that works with leading regional organizations to help countries worldwide use Earth observations and geospatial technologies to address environmental challenges. I joined a group of scientists and disaster risk reduction practitioners on a trip to view major landslide sites and better understand what satellite data can tell us about the landscape. Driving up from Kathmandu, we passed by small villages, hydropower plants, bulging retaining walls holding back hillsides, and the aftermath of past destructive landslides.
As an applied remote sensing scientist, I seek to understand the physical processes driving these hazards, how satellite data can capture these processes, and how the information from satellite data can complement the existing systems used for planning, early warning, and disaster response. While satellite data has the distinct advantage of consistently receiving data over large regions of the world, it is only a single perspective.
Visiting the field, talking to experts, and consulting with end users is critical to designing a product that is effective at reducing loss of lives and infrastructure due to natural hazards.
Cascading Hazards in Nepal
Cascading hazards (or ‘multi-hazards’) are events where one hazard triggers or increases vulnerability of a second hazard, such as a landslide that blocks a river and creates a flood. They pose a challenge to disaster managers since they can evolve quickly and the outcome can be difficult to predict. Nepal’s predominantly rural population is increasingly at risk as climate change drives extreme and erratic precipitation events that trigger cascading hazards.
During our drive, we stopped to look at the site of the Jure landslide on the right bank of the Sunkoshi River. In 2014, the Jure landslide broke free from the steep valley walls, plummeting thousands of meters to the valley floor, blocking the river, and destroying over 100 homes and lives. The natural dam quickly caused water to back up, posing a serious flood risk to upstream towns and damaging hydropower infrastructure. The Nepal Army and Police force acted quickly to dynamite a section of the dam to release some of the water downstream, but even after this quick action the threat of catastrophic flood remained. Fortunately, a month later when the dam breached, no major damage was caused by the flood waters. In addition to loss of lives and homes, damage to the road interrupted necessary services, disrupted the primary trade route with China, and impacted the tourism trade.
In addition to precipitation events, several factors increase the chance of cascading hazards in this region: glacial lakes, snowmelt, permafrost degradation, glacial deposits, high relief, and fragile topography. The Melamchi flood disaster that occurred June 15th of 2021 was triggered by heavy rainfall at higher elevations and snowmelt. This increased amount of drainage caused a glacial lake to breach. The consequent erosion of glacial deposits and natural dams downstream resulted in severe flooding that carried debris the size of boulders and triggered further landslides and riverbank erosion.
The communities here are familiar with the risk of natural hazards. They know that there is a higher risk of landslides when it rains. The current mechanisms for warning are primarily word of mouth, phone calls, text messages, and social media posts. Despite these warnings, many lives are lost during these disasters. There is still a need for an integrated multi-hazard early warning system.
The Satellite Perspective
Satellite data can be used to consistently monitor large areas for potential hazards, such as slopes at risk for landslides. Factors such as precipitation, soil moisture, slope, aspect, and even slow-motion movement can be measured via satellite and contribute to landslide hazard mapping.
NASA’s High Mountain Asia Team (HiMAT) is a group of scientists focusing on bringing the satellite perspective to these hazards. Thomas Stanley and Pukar Amatya from UMBC/NASA worked together with Sudan Bikash Maharjan from International Center for Integrated Mountain Development (ICIMOD) to develop a prototype landslide mapping and hazard awareness tool for the Karnali River Basin in Nepal. Collaborating with the National Disaster Risk Reduction and Management Authority (NDRRMA) and other government agencies, they are working to integrate the landslide hazard awareness tool into the planning and early warning process. In addition, a SERVIR applied science team is looking at how satellite radar systems can be used to monitor slowly moving slopes in the region.
The hazard awareness tool is known as Landslide Hazard Awareness for Karnali (LHASKarnali). It is a pilot project to adapt the global Landslide Hazard Assessment for Situational Awareness (LHASA) model for use in High Mountain Asia starting with the Karnali River Basin of Nepal. LHASA was previously regionalized for a SERVIR Applied Science Team project in the Lower Mekong region. It provides a one-day forecast of the hazard level for rainfall-triggered landslides by using precipitation forecasts. The LHASKarnali tool integrates forecasted precipitation from the High-Impact Weather Assessment Toolkit (HiWAT), which is managed by ICIMOD.
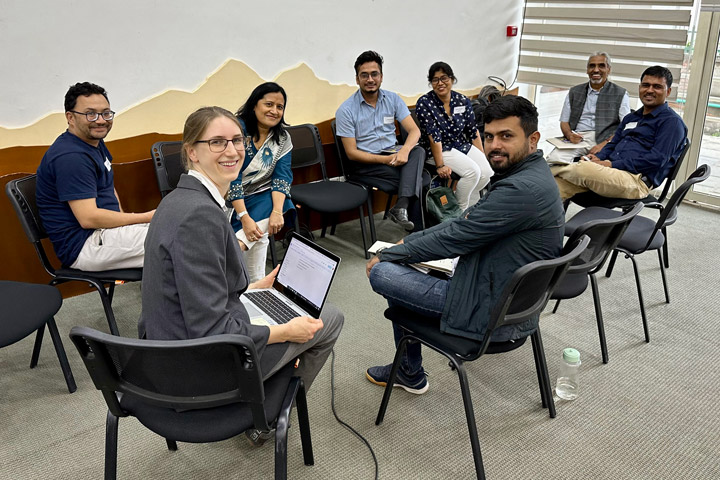
At a workshop prior to our field visit, we sought the insights of national stakeholders and academic experts, including the Department of Mines and Geology and the Department of Hydrology and Meteorology. Drawing from their experience assessing slope stability for high-risk communities, they felt that soil depth and soil moisture were among the most important factors controlling the occurrence of rain-triggered landslides. While satellite data can accurately provide data on slope, aspect, and rainfall, soil moisture is not well captured due to the steep slopes and high vegetation cover in Nepal. Although prior rainfall was used in LHASKarnali as a proxy for soil moisture, how this translates to soil moisture is unknown. These conversations helped end users think through the value of the tool and how their expertise could be used to enhance the end-product going forward.
The limitations of a 4-kilometer resolution product also stood out to participants. Response agencies like Practical Action emphasized the need to be able to identify vulnerable populations at a household or village level. Even smaller landslides can be highly destructive and more targeted warnings are important when evacuations and other high effort actions are required. Going forward, a partnership between the scientists and universities will contribute to an effort to increase the resolution of the landslide hazard forecast.
Looking Ahead
During my time in Nepal, I traversed steep river canyons, which showed me the challenge of capturing and interpreting the steep slopes and narrow rivers in satellite imagery. Talking with disaster management agencies like Practical Action and NDRRMA, I learned about the need for a joint system for multi-hazard assessment to understand the cumulative effects of landslides, floods, and other factors like the erosion of natural dams. Getting the opportunity to speak with communities and get feedback about satellite observations, such as concerns over the representation of soil moisture, help us get closer to achieving warning systems for these complex hazards.
With increasing extreme events due to climate change, being able to plan and react to these hazards is critical for resilience. It will take collective expertise and tools to tackle this complex challenge.
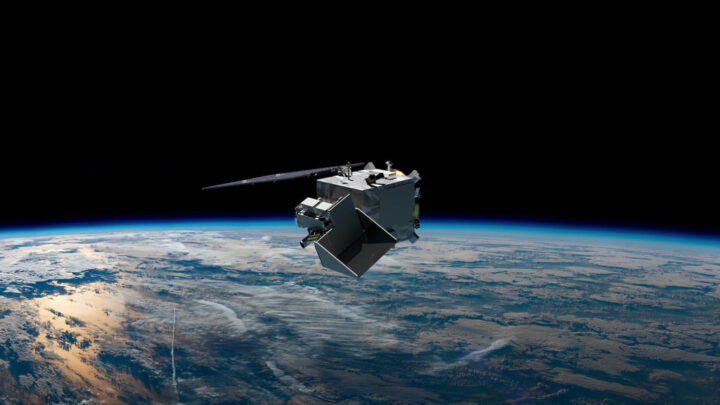
“PACE is a mission that will use the unique vantage point of space to study some of the smallest things that can have the biggest impact.” — Karen St. Germain, director of NASA’s Earth Science Division
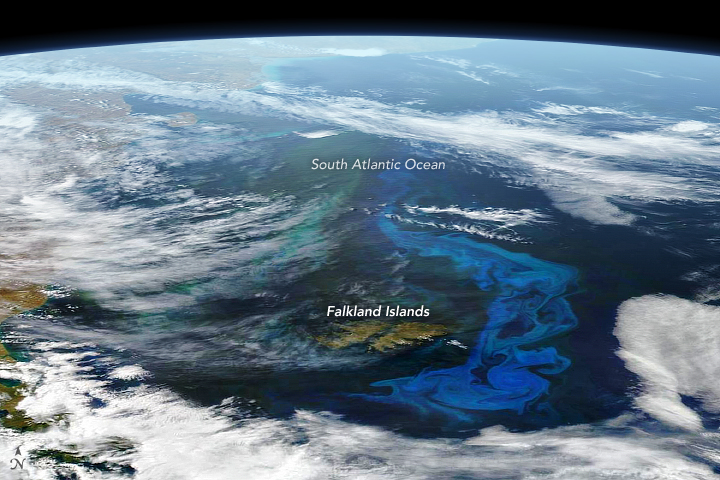
The skies above us are teeming with tiny particles of dust, sea salt, smoke, and human-made pollutants. The seas, oceans, and lakes around us are teeming with microscopic, plant-like organisms. In both cases, individual bits of these tiny living and inanimate particles are too small for your eye to see. But when billions to trillions of them aggregate in one place, we can see them from space. And these little things make a vast difference for life on Earth.
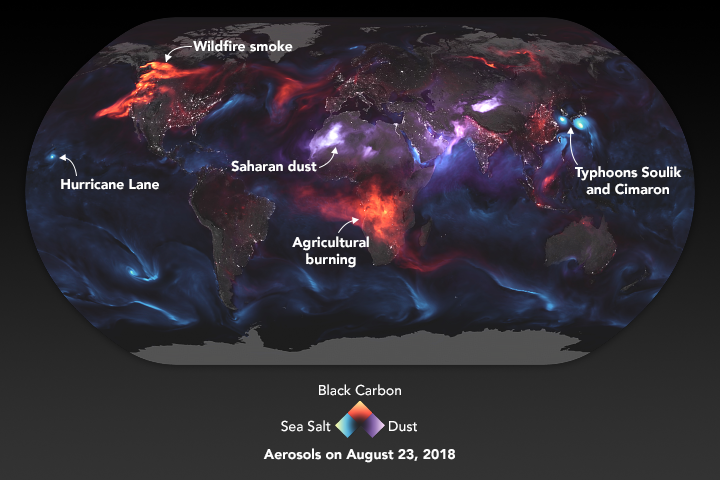
The particles in the air are known to atmospheric scientists as aerosols. Though the spray cans you might use for paint or hairspray do contain aerosols, the ones PACE will study are the flecks of carbon that rise from wildfires and smokestacks; the fine, dusty minerals that get lofted from deserts into the sky by strong winds; the nitrates and sulfates spewed by cars, trucks, and ships in their exhaust; and the salty spray from crashing waves and strong winds blowing over the ocean.
Why study them? Because those particles influence air quality, sometimes making it unhealthy to breathe, especially if you have asthma or heart and lung conditions. Pollution and smoke don’t observe borders – we all share Earth’s air — so it’s important to know something about the sources and types of particles floating around us. On the positive side, the bits of mineral dust or smoky aerosols can sometimes fertilize the ocean, providing nutrients for phytoplankton to bloom.
Aerosols also affect weather and climate. Tiny particles in the air reflect sunlight, and how much they reflect affects how much the land and ocean surfaces heat up. Aerosols also “seed” the formation of clouds: they provide surfaces on which water droplets form (condensation nucleii) as they aggregate into clouds. One of the great unknowns in our models of climate change is what role will aerosols will play in changing rainfall and snowfall patterns and in the heating or cooling of our atmosphere.
Though NASA has been studying aerosols from space for decades — observing where they are and the abundance of them — PACE and its SPEXone and HARP2 polarimeters will change the game. The instruments will tell us the shape and size of aerosols, helping us answer questions about where they come from and how they might influence other parts of the Earth system.
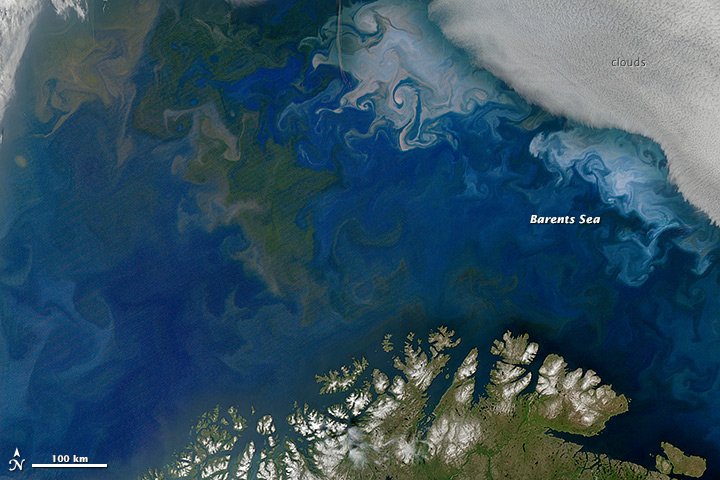
The other little things that PACE will examine have names like diatoms, coccolithophores, cyanobacteria, algae, and dinoflagellates. To borrow and mangle a quote from one of my favorite movie characters — Annie Savoy in Bull Durham — if you have three phytoplankton, they can’t do much. But if you have 300 billion of them, they can build a cathedral. Well, maybe not a cathedral, but they can develop into vast blooms that have a profound impact on life on this ocean planet.
Phytoplankton grow constantly on Earth and just about anywhere there are open, sunlit patches of water. When conditions are right, the growth of these microscopic cells can blossom to scales that are visible from orbit for days to weeks.
Phytoplankton are to the ocean what grasses and ground cover are to land: primary producers, a basic food source for other life, and the main carbon recycler for the marine environment. They are floating, plant-like organisms that soak up sunshine, sponge up nutrients, and create their own food (energy).
Why do we need to study these tiny organisms with PACE? While humans don’t really consume phytoplankton for food, the little floaters are fuel for the zooplankton, fish, and shellfish that we do eat. We also need to care about phytoplankton because they can influence water quality and human health. Some species of phytoplankton produce toxins that are dangerous to humans and animals; others can grow in such abundance that they crowd out other species or deplete the water of necessary oxygen.
Speaking of oxygen, phytoplankton produce a lot of it. Somewhere between 20 and 50 percent of the oxygen on Earth — some in our air, a lot in the ocean — is made by phytoplankton as they use photosynthesis to turn sunlight, carbon dioxide, and nutrients into sugars. In the process, they also draw carbon dioxide out of the atmosphere and, in time, sink it to the bottom of the ocean.
Better understanding the phytoplankton in the ocean will help us better understand the fisheries that feed us and our economy, and it can ultimately help us work toward cleaner waterways.
NASA and its research partners have been studying phytoplankton from space for decades, but mostly with just a few wavelengths of light. I am looking forward to the colors, textures, and details we will see with PACE’s OCI hyperspectral imager. As the PACE science team likes to say: we have been coloring the ocean with a box of 8 crayons, and now we are about to get a box with 128 shades of color. The leap in detail will allow scientists to better spot where phytoplankton are, but also figure out who (what species) they are.
And when PACE data are combined with observations from our recently launched SWOT mission — which studies the shape and movement of the surface of the ocean — it will be like going from the Earth-observing equivalent of the Hubble Space Telescope to the new James Webb Space Telescope.
Learn more about phytoplankton with these resources:
PACE Phytoplankton Exploration
The Insanely Important World of Phytoplankton
NASA Wants to Identify Phytoplankton Species from Space: Here’s Why.
As the Seasons Change, Will the Plankton?
Phytoplankton May Be Abundant Under Antarctic Sea Ice
Learn more about aerosols with these resources:
Just Another Day on Aerosol Earth
New NASA Satellite to Unravel Mysteries About Clouds, Aerosols
Global Transport of Smoke from Australian Bushfires
A few paths in life are short and direct; more of them are long and winding.
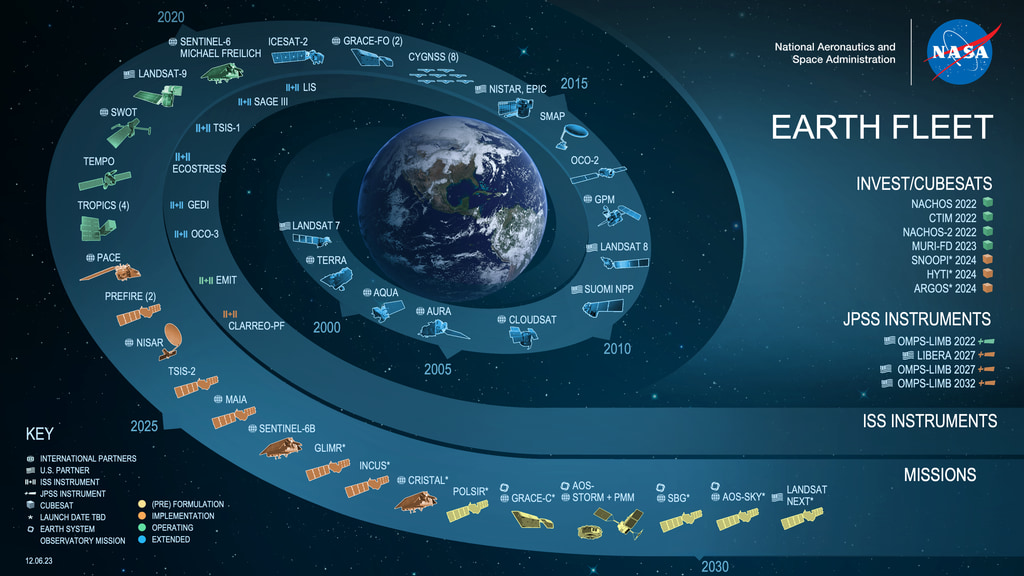
This week, a SpaceX Falcon 9 rocket will launch from Cape Canaveral Space Force Station carrying the PACE satellite, short for Plankton, Aerosol, Cloud ocean Ecosystem. Once in orbit 676 kilometers (420 miles) above our planet, the newest addition to NASA’s fleet of Earth-observers will look at the oceans and land surfaces in more than 100 wavelengths of light from the infrared through the visible spectrum and into the ultraviolet. It will also examine tiny particles in the air by looking at how light is reflected and scattered (using a method like looking through polarized sunglasses).
The combination of measurements from the new satellite will give scientists and citizens a finely detailed look at life near the ocean surface, the composition and abundance of aerosols (such as dust, wildfire smoke, pollution, and sea salt) in the atmosphere, and how both influence and are affected by climate change.
For NASA and the ocean science community, the PACE launch will be the culmination of 9 or 46 years of work, depending on when you start counting. For me, it will be the culmination of something that started in 1950.
“There is a greater than 50 percent chance I will burst into tears at the launch,” said Jeremy Werdell, a satellite oceanographer at NASA’s Goddard Space Flight Center since 1999 and project scientist for PACE since 2015. “We are standing on the shoulders of previous missions and the people who led them. And it has been a long and remarkable journey.”
NASA’s first attempt at measuring ocean color dates back to the Coastal Zone Color Scanner (CZCS) instrument, which flew on the Nimbus 7 satellite from 1978-1986. In 1997, the agency launched the Sea-viewing Wide Field-of-view Sensor on the OrbView-2 satellite. SeaWiFS collected ocean data until 2010 and fundamentally changed our understanding of phytoplankton—microscopic, floating, plant-like organisms that are the grass of the sea. That sensor is an ancestor of the new Ocean Color Instrument (OCI) on PACE.
Other instruments and teams have observed the colors of the ocean. The Moderate Resolution Imaging Spectroradiometer (MODIS) instruments on NASA’s Terra and Aqua satellites have been flying since 2000 and 2002, complementing and extending the record started by SeaWiFS. More recently, the Visible Infrared Imaging Radiometer Suite (VIIRS) instruments on the Suomi-NPP, NOAA-20, and NOAA-21 satellites have provided a broad view of ocean color. And several other instruments — like the Hyperspectral Imager for the Coastal Ocean (which flew on the space station), HawkEye (on the SeaHawk CubeSat), and the Ocean Radiometer for Carbon Assessment (which was flown on NASA research planes) — helped researchers test new ways to look at the sea.
For atmospheric scientists, the path to PACE also traces back across decades. In the late 1970s, the Advanced Very High Resolution Radiometer (AVHRR) provided some of the first looks at aerosol optical depth, a measure of how much dust and particles were floating in our skies. Later scientists began measuring such particles daily and around the world with the Multi-angle Imaging SpectroRadiometer and MODIS instruments on Terra. The OMI instrument on the Aura satellite, and its successor OMPS on Suomi-NPP, provided other unique views of aerosols. A HARP instrument flew on a CubeSat from 2019-2022 and provided a direct test of the technology that now flies on PACE as HARP2.
The origin of PACE itself sort of started around 2007. NASA and other federal agencies asked the U.S. National Research Council to study and suggest new tools and measurements for studying Earth from space. Their report (known as a “decadal survey“) recommended a mission that ultimately led to the A(erosol) and C(loud) components of the PACE mission. The inspiration for new ocean color sensors then arose from a NASA climate initiative proposed in 2010.
By 2012, NASA scientists and engineers were starting to sketch out rough ideas for PACE, and the wider science community dug into the details in 2014. By 2015, NASA Goddard started hiring for a new mission—including Jeremy Werdell—and by 2016, the agency had announced the formal development of a PACE mission.
Between that moment in 2016—known as Key Decision Point A—and this week’s launch there have been thousands of hours of work by hundreds of people…including many months working through a global pandemic…and the methodical, thoughtful testing of every idea, every design, and every part.
For me, the road to the PACE launch has also been long.
I have spent 21 years of my life working for NASA, and yet this will be my first launch. I feel blessed to spend my days working with incredibly talented, visionary, and smart people. This launch feels like the culmination of a lifetime geeking out on Earth and space science. Several threads of my life will all tie together this week.
In 1950, a 7th grader in Newark, New Jersey, won an essay contest by writing about a trip to the Moon. My father was fascinated by science fiction—he still is—and by journalism. He followed America’s developing space program with interest and, in 1969, his youngest son was born two weeks after the Apollo 11 Moon landing. Though no one can remember clearly, I like to say my parents named me for Michael Collins, who quietly orbited the Moon for 21 hours while Neil Armstrong and Buzz Aldrin made the headlines below. (My mother often reminded me that she went through a similar 20+ painstaking hours of labor waiting for me to show up.)
On my first job as a magazine writer, I wrote in 1992 about the Mission to Planet Earth—first an international conference, then an early name for what became NASA’s Earth Observing System. I visited NASA’s Jet Propulsion Laboratory in 1994 to research my graduate thesis and by 1997 I had joined NASA Goddard, where I stayed for five years writing about space weather and space physics.
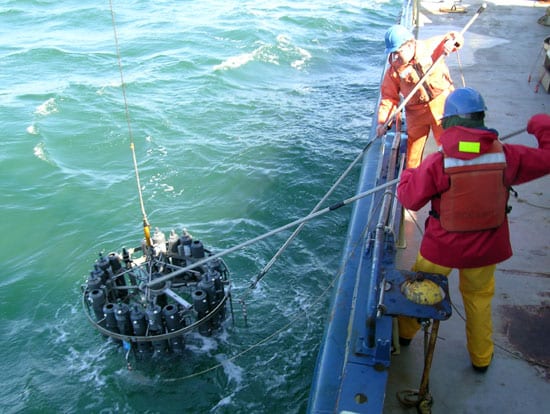
But then I traded one institution of exploration for another, leaving to write about ocean science for Woods Hole Oceanographic Institution (WHOI). It was during those years on Cape Cod that I learned a boatload about phytoplankton and harmful algae. I spent 11 days at sea in 2005 on the research vessel Oceanus, helping scientists gather water samples to track a pesky, toxic phytoplankton called Alexandrium fundyense. After decades visiting the ocean, I was living by it and learning about it daily.
I rejoined NASA in 2008 and eventually joined Earth Observatory. Circumstances and generous colleagues allowed me to keep living by the sea, and so I brought my love of the ocean into my reporting. I also passed that love of the ocean and space to my children: Two have become marine biologists who study plankton, and one is an aerospace engineer working on satellites.
After so many years of my life intersecting with NASA and the sea, it just feels right that my first rocket launch should be a satellite that will bring us new eyes on Planet Ocean.
Fieldwork notes, July 21-August 3, 2023
Summer fieldwork for our project, “Clarifying Linkages Between Canopy Solar Induced Fluorescence (SIF) and Physiological Function for High Latitude Vegetation,” once again took our team from University of Maryland Baltimore County north to the boreal forests of central Alaska. We visited this area in the spring to collect data during the very start of the growing season, and now we are returning to collect data during the peak of summer.
This project is part of the NASA Terrestrial Ecology program’s Arctic-Boreal Vulnerability Experiment (ABoVE). The goal of ABoVE is to improve our understanding of high latitude ecosystems, how these ecosystems respond to climate change, and how satellite data can provide information to describe ecosystem processes and aid management decisions.
Our study focuses on measuring light emitted by plants called solar induced fluorescence. Green leaves absorb light, and through photosynthesis take in carbon dioxide and water and produce oxygen and sugars. Fluorescence occurs during photosynthesis as some of the absorbed light energy is radiated out from the plant. The amount of light fluoresced is only a very small fraction of what is absorbed, which is why our eyes don’t see plants glowing. In our study, we use sensitive instruments that can detect this fluorescence. Our goal is to better understand the sources of fluoresced light and how to use this information to describe productivity in boreal forests and tundra.
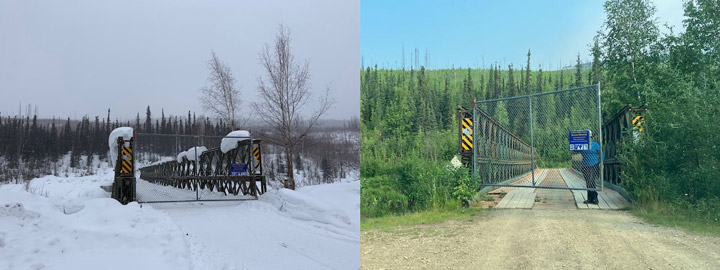
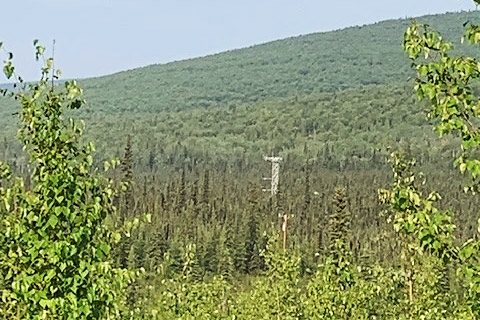
Our study site is at the Caribou Creek flux tower run by the National Science Foundation’s National Ecological Observatory Network (NEON). In spring, we deployed automated instruments at the NEON tower site that continuously collect data. On this trip, we are checking on how they have been working.
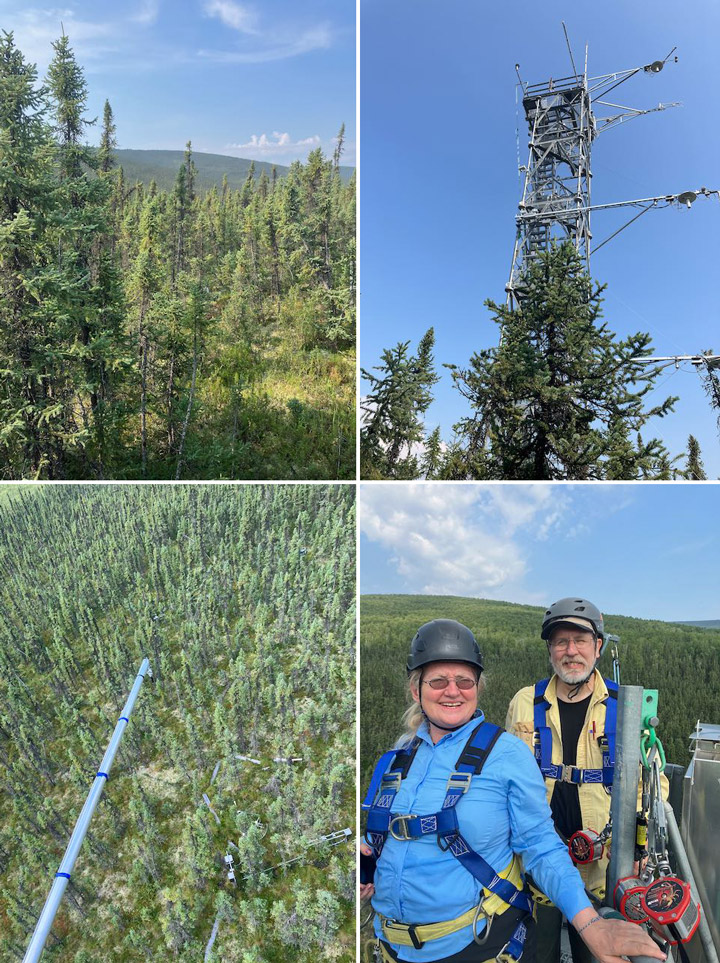
In July there was a big change from our previous visit in April. In April, the area had a deep snow cover with temperatures dropping below 0°F, while during this visit the daytime temperatures were in the 80s F and the ground was now all green (images below).
On the top of the tower we have an instrument called a FLoX (Fluorescence Box). The FLoX views a patch of forest from above, and every few minutes during the day it measures the reflected light and solar induced chlorophyll fluorescence. This provides us with a description of plant activity at different times of the day through the growing season (images below).
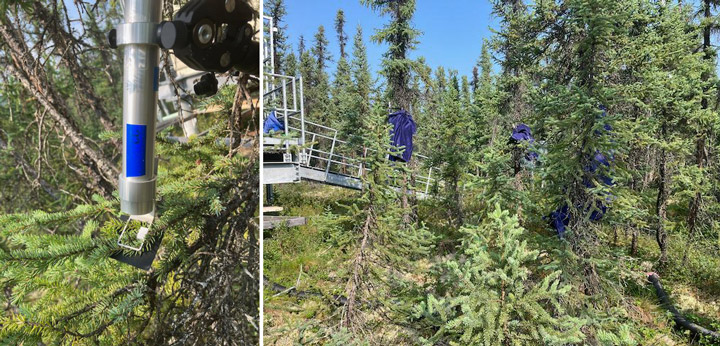
Also at the site we have monitoring PAM (MoniPAM) instruments attached to shoots of the spruce trees. The MoniPAM probes shine pulses of light at individual spruce shoots to measure fluorescence and photosynthetic processes at the leaf level (images below). We put blankets over the probes for a while to dark-adapt the shoots to measure their response when unstressed. In the spring, we put the MoniPAM probes in easy-to-reach places when there was a lot of snow on the ground. On this trip, when we returned to check them in the summer, we found we had to really reach up to get them without the snow to stand on.
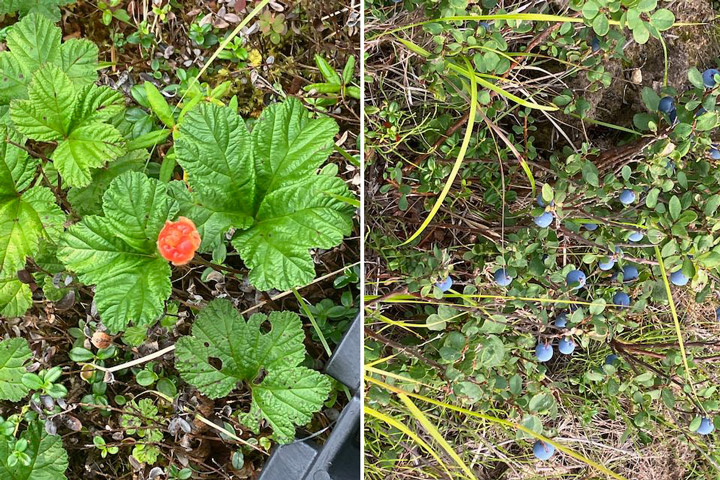
From the ground, we collected reflectance and fluorescence measurements (similar to the data collected by the FLoX) of individual plants in the FLoX field of view and a variety of representative plants in the larger area surrounding the tower. These measurements will help us understand the local variability (images below).
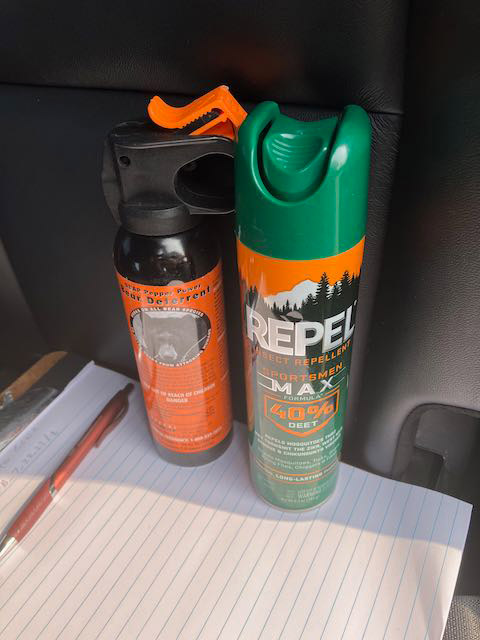
A lot of the ground cover was cotton grass (Eriophorum spp.) that forms tussocks, which are tight clumps of grasses. The tussocks made walking through the area difficult, like walking on half-buried basketballs, so it was easy to twist an ankle, especially with a heavy backpack spectrometer on your back.
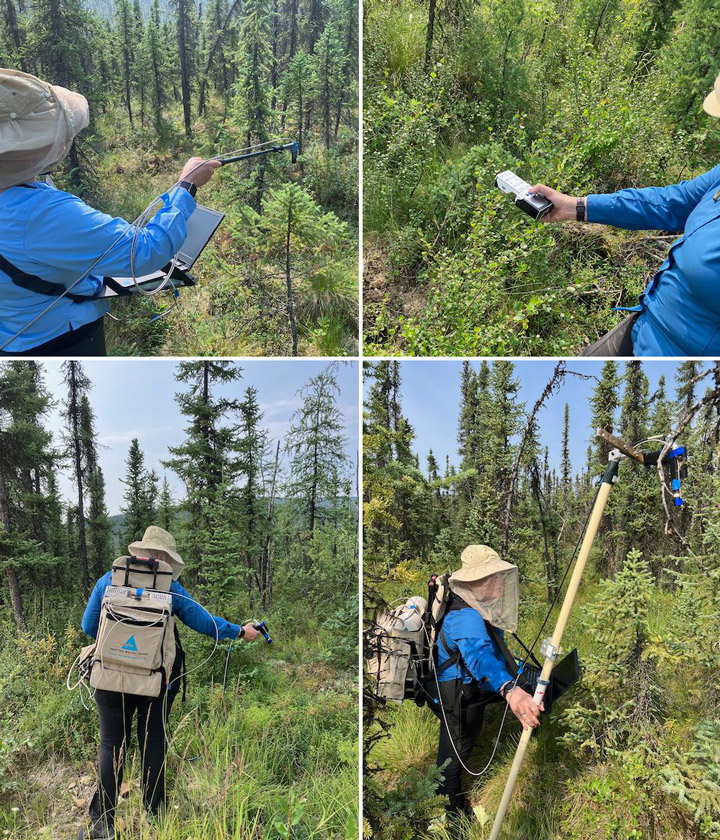
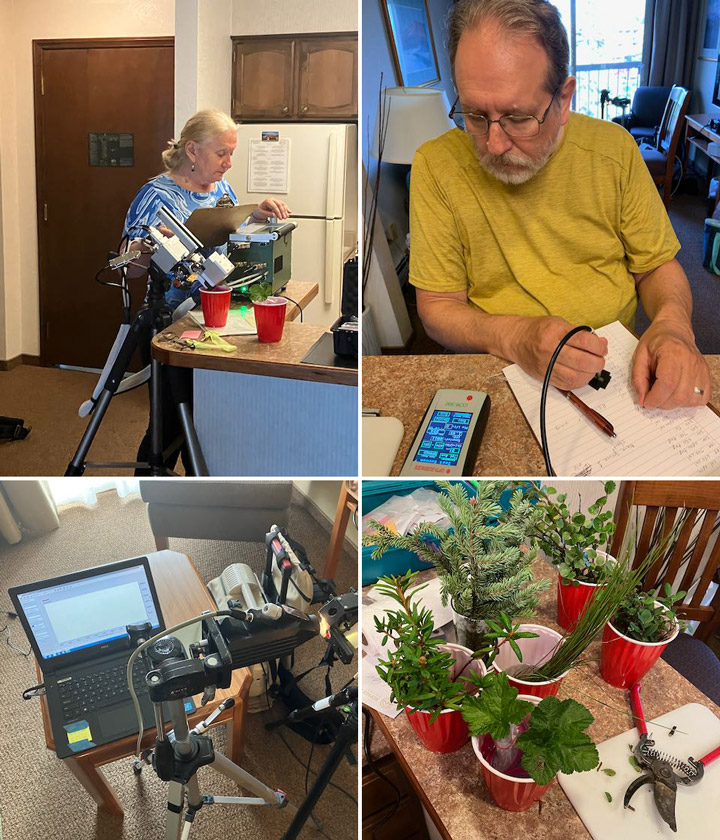
We collected branch samples to make measurements of leaves and needles that we will use to parameterize models of vegetation fluorescence and productivity (images below).
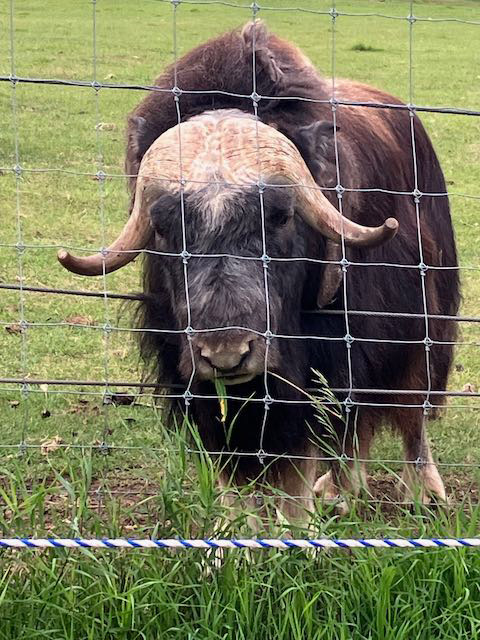
We took a little time off to visit some other places in the area. We saw musk ox, which are animals of the tundra but raised in captivity at the University of Alaska Fairbanks’ Large Animal Research Station. Their thick, shaggy coat keeps them warm through the frigid arctic winters. Under the long guard hairs is a soft wool called qiviut that musk oxen shed in the spring. Qiviut can be spun into a very warm and soft yarn. Small balls of qiviut yarn can sell for over $100.
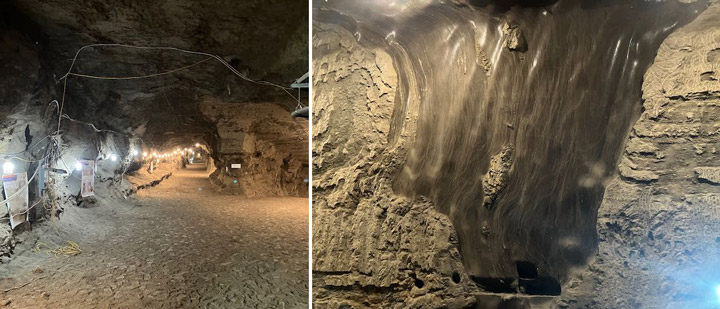
On our last day in Alaska we visited the Cold Regions Research and Engineering Laboratory (CRREL) Permafrost Tunnel Research Facility (images below). Permafrost refers to soil that has been frozen continuously for more than two years. The permafrost around Fairbanks, Alaska, is considered ‘warm’ (at a temperature of -0.3oC/-0.4oC) as compared to the permafrost in our other study site in the North Slope of Alaska at Utqiagvik (e.g., a temperature -3oC/-4 oC). This warm permafrost is very sensitive to the changes in soil temperatures that can result from fires, rain events, and other disruptions that can cause permafrost thawing. Thawing permafrost can result in damage to roads and buildings and cause disturbance in forests.
The permafrost tunnel is dug into a hillside through earth that has been frozen for thousands of years. The tunnel reveals bones of extinct ice age animals, plants preserved since the ice age, and large ice wedges that can take hundreds to thousands of years to form. The ice wedges cause the formation of polygonal patterned ground, where the ground surface is covered with a pattern of shapes of slightly higher or lower ground. Our study site in Utqiagvik was in an area of high centered polygons, so it was interesting to be able to actually see the shapes of the underground ice that formed that unique landscape.
